Obstacle Impact on Temperature and Wind
Dr. Stavros keppas, 12/08/2025
We installed two weather stations on a rooftop to investigate how nearby walls and other obstacles might affect weather measurements. One station, our reference station (considered the reliable installation, see Figure 1, Station A - WS1000), was placed at the highest point of the roof, where there were no obstacles taller than the station that could interfere with its readings. The second station, the “obstructed” installation in our experiment (see Figure 1, Station B - WS1001), was placed in a location (see Figure 3) where:
- To the east, a wall 3 m taller than the station is located 5 m away (instead of 21–30 m as suggested by (WMO)).
- To the west-northwest, a small structure at a similar height as the station, with solar water heaters adding 2 m in height, is located ~5 m away (instead of 21-30m that it should according to (WMO)).
- To the northwest, a triangular wall 2 m taller stands 8–9 m away.
- The south-southwest horizon is relatively open (instead of 21-30m that it should be according to (WMO)).
- The southern horizon is completely open without obstacles.
For the data analysis, we used air temperature, wind speed and direction, and solar irradiance.
- For temperature, we used summer data (10/05/2025–10/08/2025), when urban surfaces are more thermally stressed.
- For wind, we used a longer time series (10/11/2024–10/08/2025) to provide a larger sample.
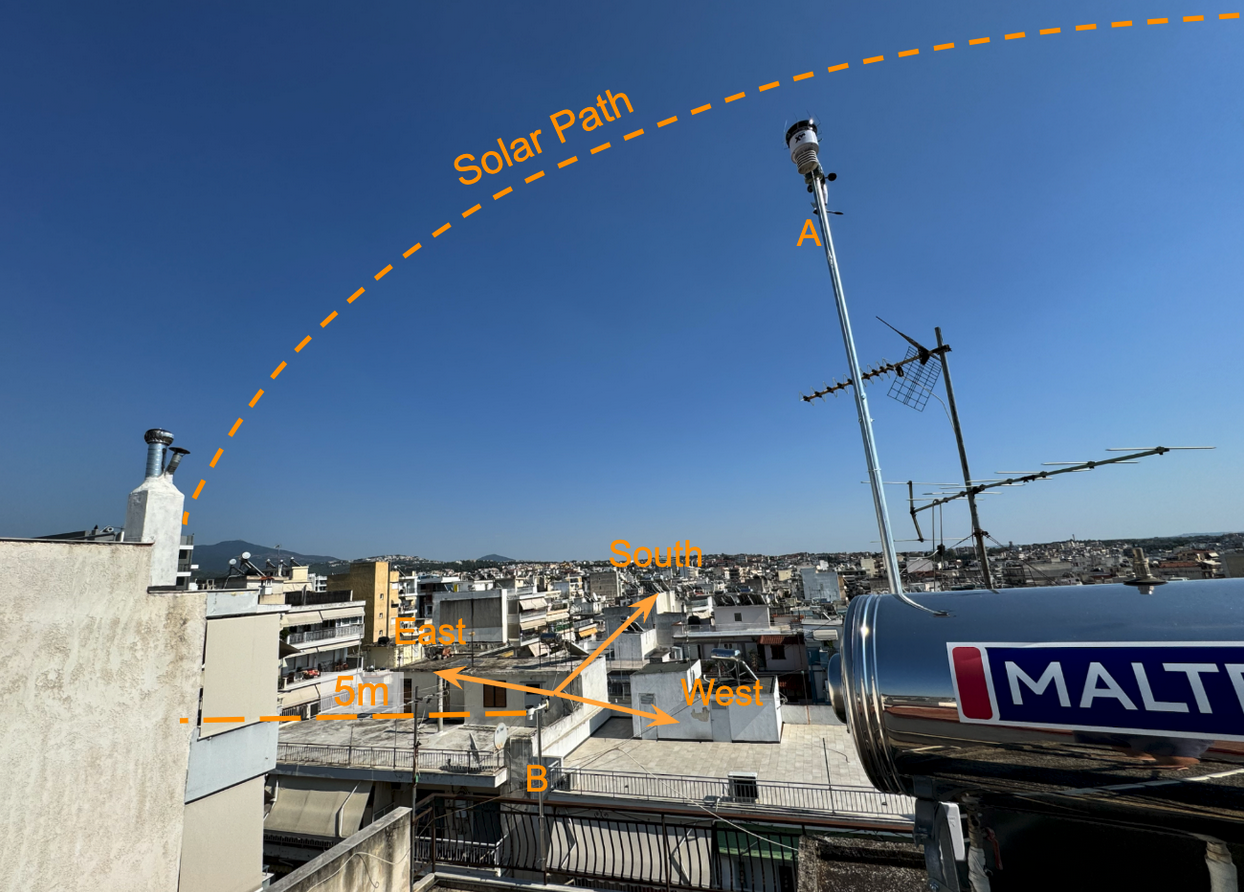
Figure 1. The experimental setup with the two stations. Station A is used as a reference and free-of-obstacles station, while station B is used as the problematic and to-be-investigated station that is surrounded by significant obstacles.
Temperature Impact
Regarding temperature, although the wind sample is not evenly distributed across all directions (due to the local climatology, some wind directions occur more or less frequently), there appears to be a pattern that can be explained by the station’s surroundings. More specifically (Figure 2):
- The largest positive temperature differences (with the 90th percentile of biases ranging from 0.34°C to 0.99 °C) are observed when the wind blows from directions where there is an obstacle (thus from north, northeast, east, southwest, west, and northwest).
- Qualitatively, the graphs suggest that the largest positive deviations usually occur when the sun is positioned in the southern or southwestern part of the sky (solar azimuth). At this solar azimuth, the incident solar radiation on the east-facing wall is at or near its maximum, resulting in the greatest potential heating of the surface.
- For winds from the south and southeast, the temperature differences are usually negative or close to zero (−0.92 °C to -0.13 °C).
This behaviour could be explained by the fact that when wind is blocked by an obstacle, the heat stored in the wall is not dispersed by air circulation, so the air on the sheltered side of the wall warms up more. On the other hand, when wind flows towards the obstacle, it removes heat from the surface, and the nearby air becomes cooler.
The frequently negative differences in these cases may be due either to differences between the sensors or to the fact that south of Station B there is no concrete (as it is located at the edge of a five-storey building), while south of Station A there are concrete rooftop surfaces that emit some heat. To explain this case a bit deeper, air tends to acquire the thermodynamic properties of the surface it passes over. Although the short distance involved would normally limit significant changes in these properties, in low wind conditions air can theoretically remain over a surface for longer and acquire new thermal characteristics. It should again be emphasised that the unequal sample sizes for each wind direction may reduce the confidence of these conclusions.
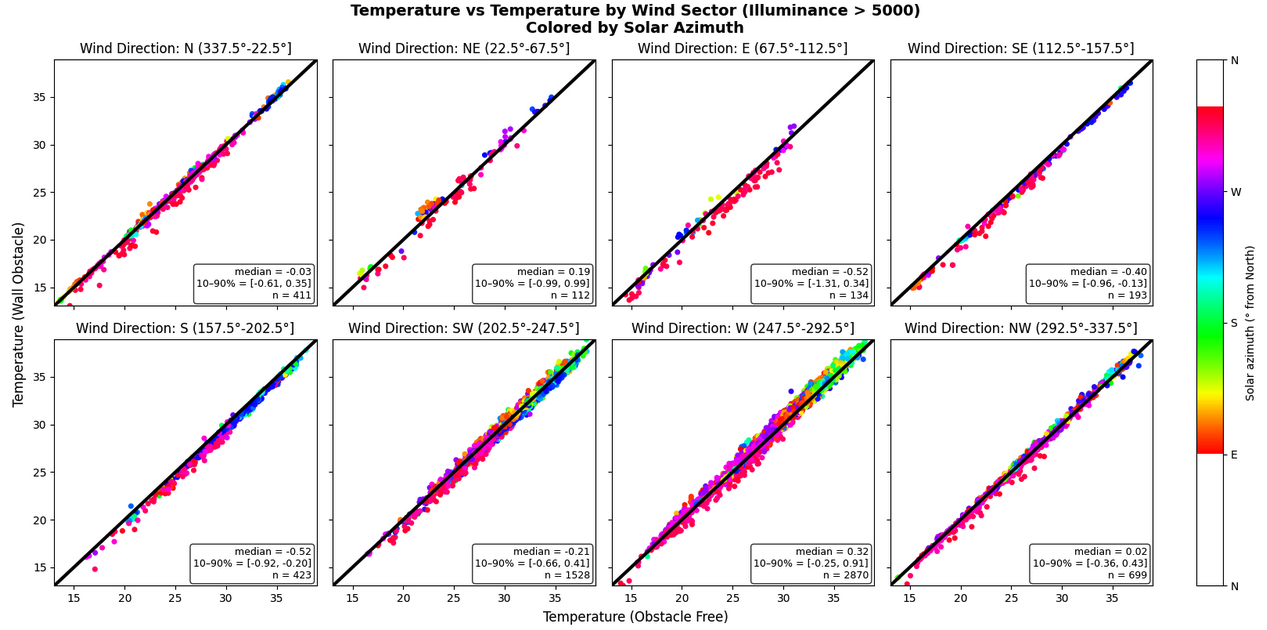
Figure 2. Relationship between temperature measured by station A (Obstacle Free) and station B (Wall Obstacle) for grouped wind directions. The markers are coloured by the solar azimuth. The median, 10th–90th percentile and the number of the considered sample is shown in the in-plot frames. For the analysis only data coinciding with Illuminance >5000Lux (40W/m2) were used to investigate the impact of solar radiation heating on measurements. The data were aggregated in 10-min intervals to securely identify the wind direction.
Wind Impact
The effects of obstacles on wind measurements are much more distinct and easier to interpret. The obstacles around Station B (Figure 3) are clearly reflected in the wind rose (Figure 4):
- Average wind speeds from the north through to the east-southeast sector (0-135°) are significantly lower at Station B (by up to >1.5 m/s), especially from the east-northeast direction, where the main wall is located.
- In the east-southeast directions, wind speed at Station B tends to recover slightly but still remains lower. This is likely because the wall continues to have some influence on the overall air circulation and flow. Additionally, when winds are from the east, their actual direction may fluctuate between NE and SE, but the measured speed remains reduced due to friction with obstacles and because both wind speed and direction have been averaged over one-minute intervals.
- In the west to west-northwest sector (225-292.5°), although the obstacles there appear less substantial, they still have a significant effect, reducing speeds by up to 1 m/s.
- The absence of obstacles to the south is clearly visible: for winds from the south-southeast to southwest sector, average wind speeds are comparable between both stations.
- Obstacles to the north and north-northwest appear to have a smaller impact on measurement quality, likely because they are further away and not continuous, with openings through which air can occasionally pass.
- Overall, Station B consistently records lower average wind speeds, even from directions where the horizon is free of obstacles. This is likely because it is installed closer to the rooftop surface, where friction between the air and surfaces is stronger (Figure 5a). Additionally, for southerly winds, the airflow approaching the building may be deflected upward upon encountering the structure, reducing the speed recorded by the station (Figure 5b).
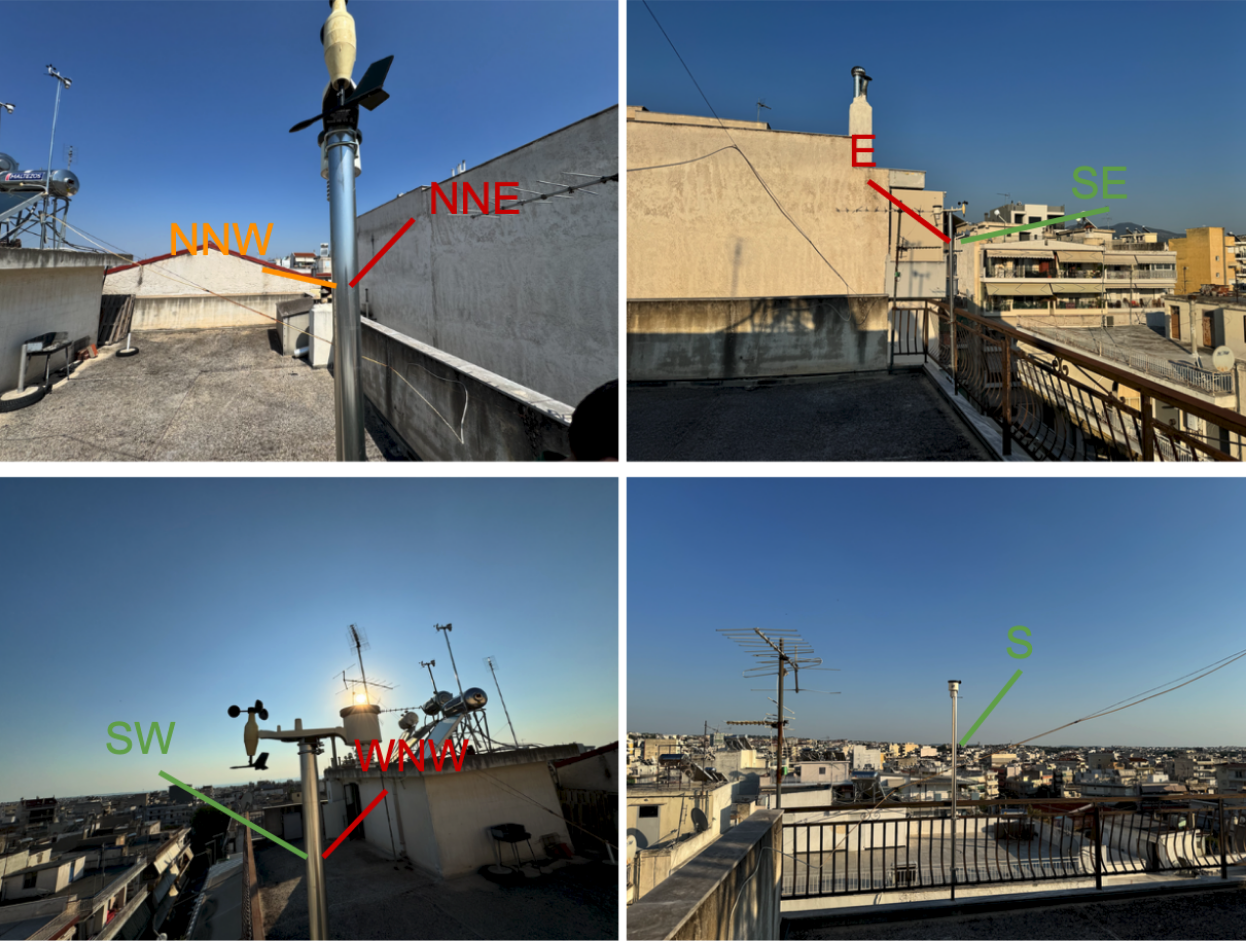
Figure 3. The surrounding area of station B. The free-of-obstacle, partly blocked and blocked directions are indicated by green, orange and red lines together with the pointing direction.
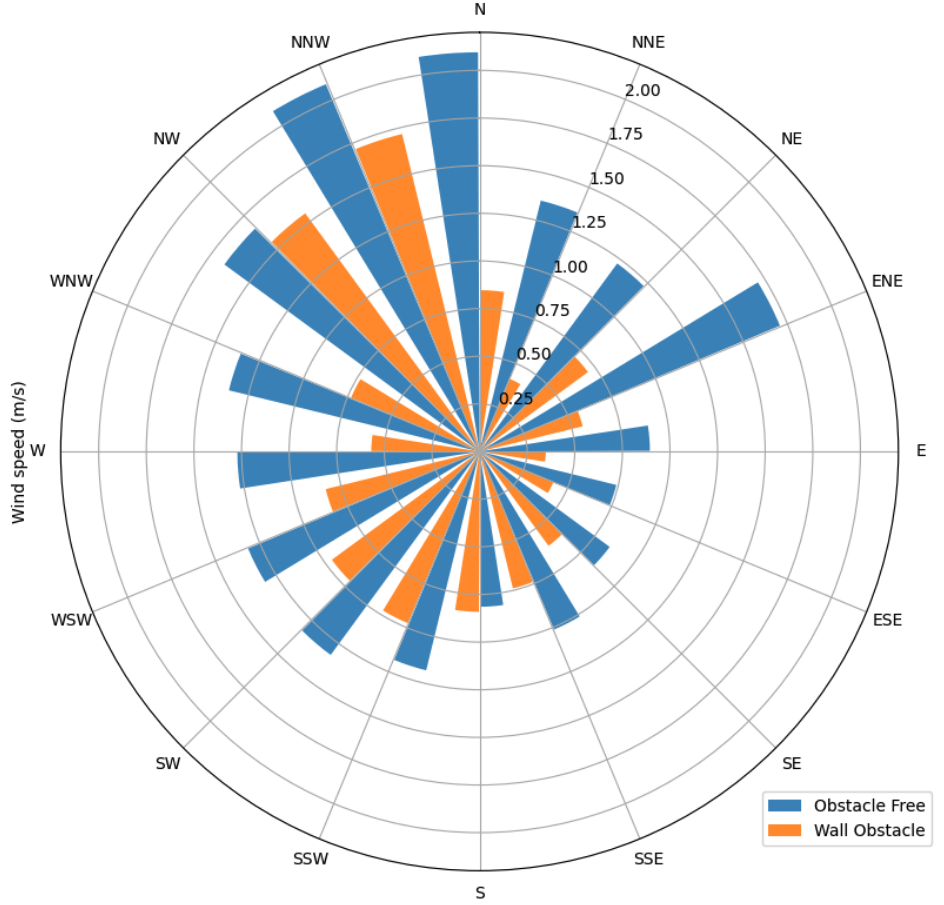
Figure 4. Wind rose showing the average wind speed per cardinal direction for Station A (Obstacle Free) and Station B (Wall Obstacle). 10-min wind averages were used for the plot.
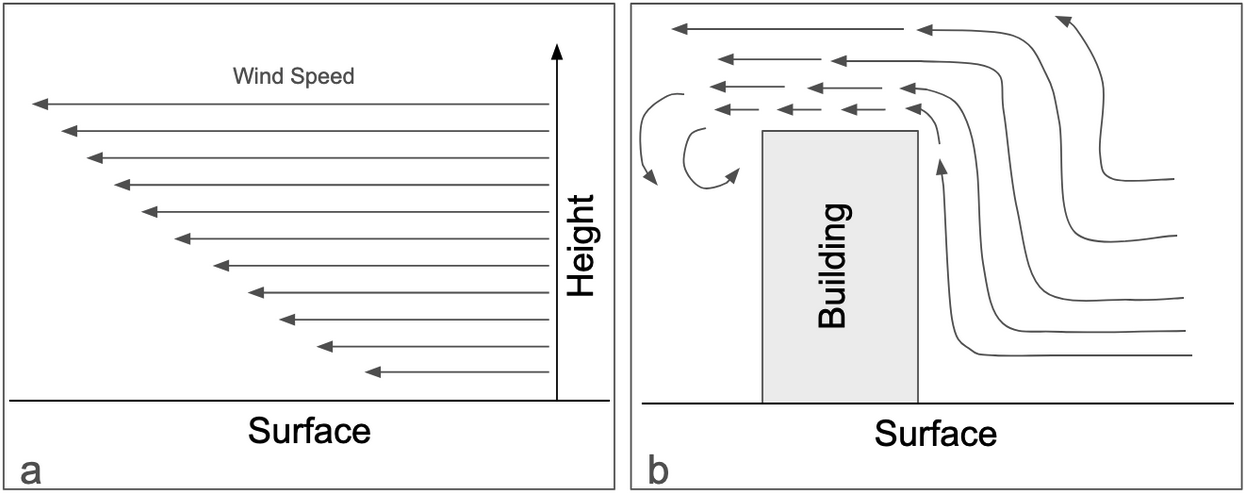
Figure 5. Qualitative and simplistic schemes of air flow and wind speed (a) above a horizontal surface (NASA) and (b) a building (AIVC.org; WMO).