Constancy Analysis Report
Dr. Stavros Keppas, 21/09/2023
One of the sub-processes within the Self-Quality-Check (SQC) of the Quality of Data (QoD) mechanism involves the examination of data to identify instances where it appears suspiciously unchanging for extended durations. According to (WMO) guidelines, constant temperature, relative humidity (RH), wind, and pressure data, should be flagged as suspicious if they remain constant for longer than one hour, with the exception of RH, which applies only when it exceeds 95%.
1. Data and Method
To ensure that we tailor these criteria to match the specifications of WeatherXM’s weather stations and to flag not suspicious but actually erroneous data, we utilised up to one year of data (09/2022 to 09/ 2023, where available) from 18 well-deployed weather stations at various locations (coastal, continental, lowland, hilly at various latitudes) (Figure 1). This extensive dataset allowed us to assess the constancy of key parameters, namely temperature, RH, and wind speed, which are prone to remaining unchanged for prolonged periods.
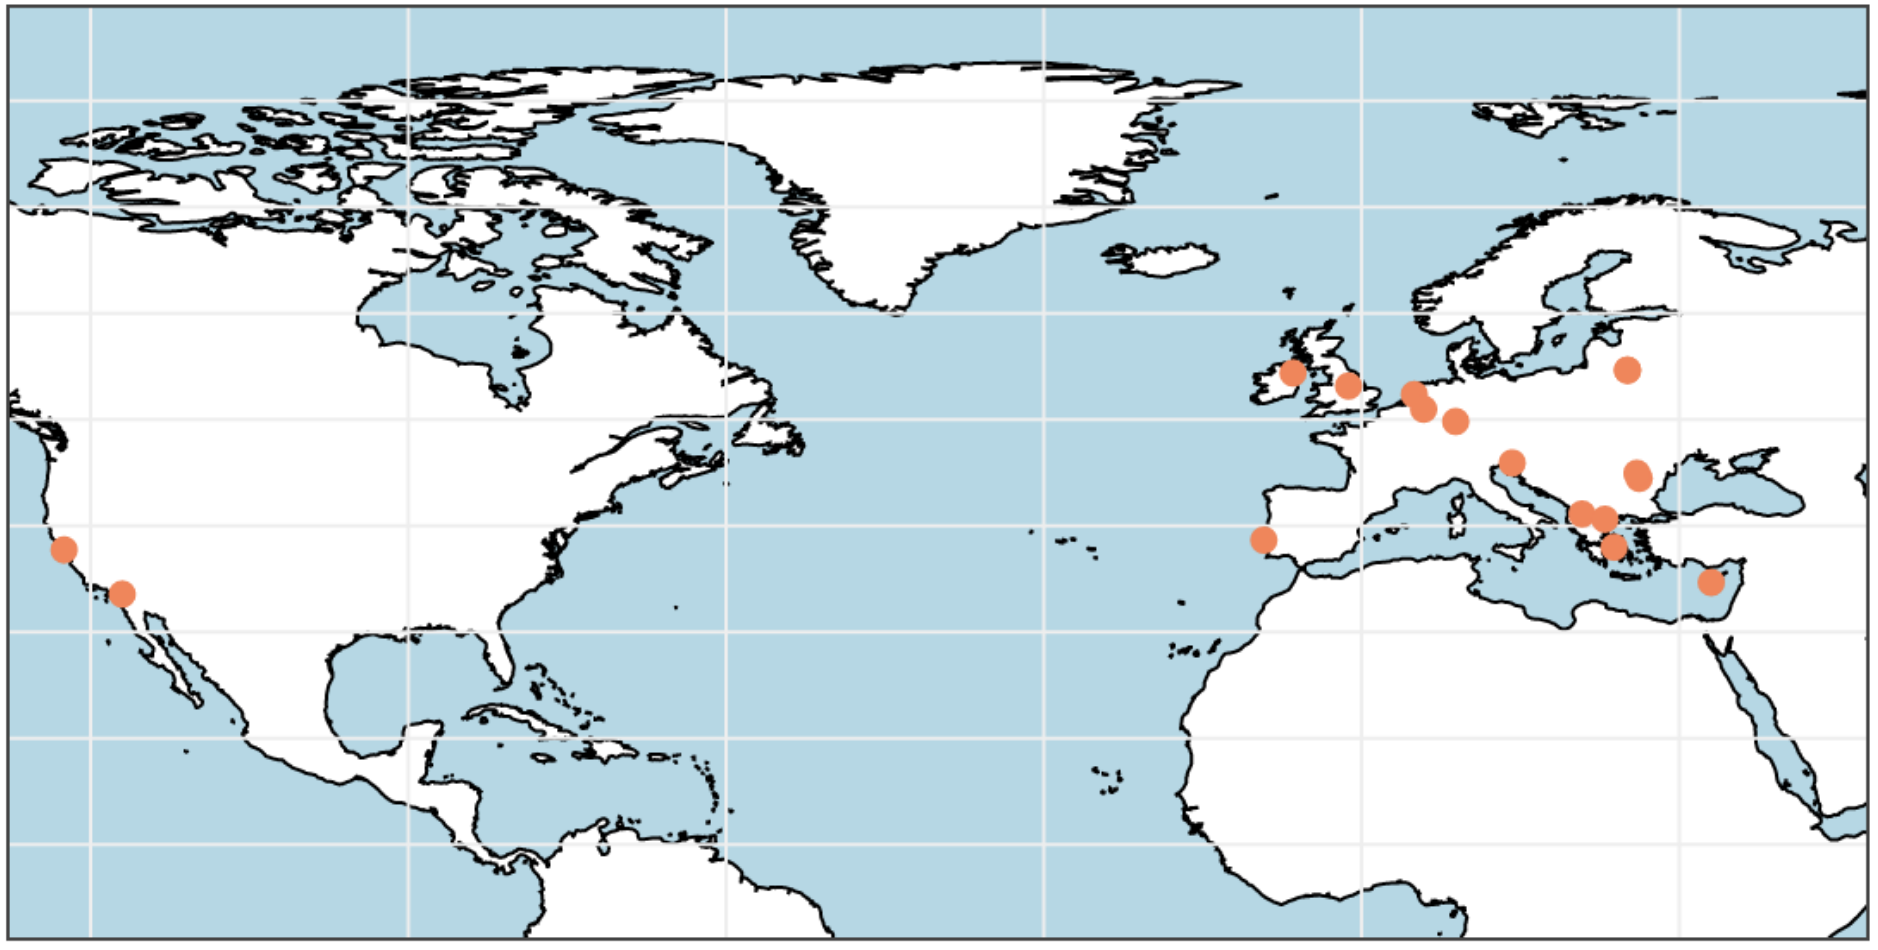
Figure 1. Locations of the weather stations used for the constancy analysis.
The datasets were averaged over 1 minute intervals, which corresponds to the "ignoring period" (during which we populate empty rows with data to facilitate Quality of Data processes - see QoD documentation section 1) chosen in the Quality of Data (QoD) mechanism. Then, we determined the duration of time during which consecutive observations remained at a certain value.
2. results
Here, we examine the patterns and correlations among three parameters (temperature, RH and wind speed), when they exhibit prolonged periods of constancy. The objective of this analysis is to identify meteorological conditions that may explain why a parameter remains constant for extended hours. Conversely, it inevitably seeks to highlight conditions that are less conducive to the persistence of constant values over extended periods.
The analysis reveals that temperature tends to remain constant for relatively brief periods, typically less than 100 minutes (Figure 2). Nevertheless, there were instances where the duration exceeded 200 minutes, coinciding with RH levels surpassing 95%. Therefore, it is advisable to establish a conservative threshold for constancy duration, setting it at 240 minutes, while median RH does not exceed 95%.
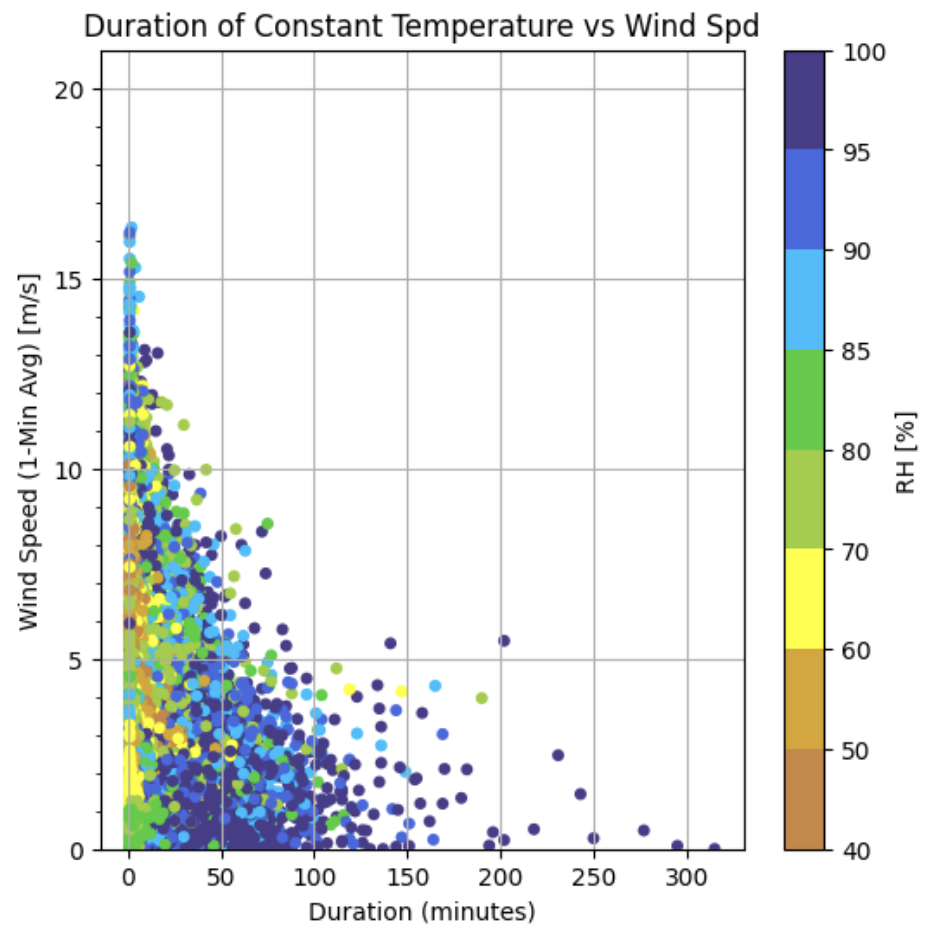
Figure 2. Duration of constant temperature (in minutes) versus median wind speed for the period of constancy. The scatter points are coloured based on the median relative humidity observed during the same constancy period.
RH exhibits a capacity to remain constant for significantly longer durations compared to temperature (Figure 3). In certain instances, RH can remain constant for over 2000 minutes. However, when examining constancy durations exceeding 305 minutes, it becomes evident that the median RH was consistently ≥95%. Therefore, it is advisable to establish a constancy threshold of 360 minutes for cases where the median RH is <95%.
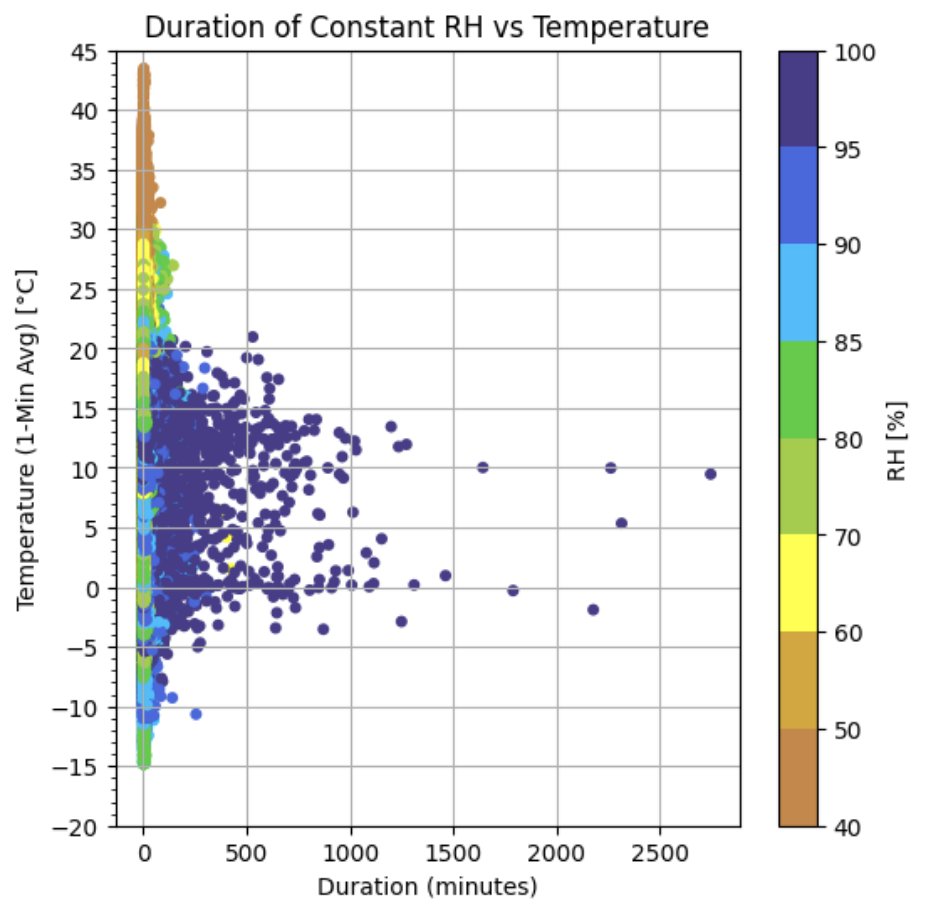
Figure 3. Duration of constant relative humidity (in minutes) versus median temperature for the period of constancy. The scatter points are coloured based on the median relative humidity observed during the same constancy period.