Indoor Station Detector (ISD)
1. Introduction
Indoors Station Detector (ISD) is a component of the Quality of Data (QoD) mechanism that is responsible for scoring the quality of the weather data and the deployment of the weather stations.
The ISD is a component of the Self Check process (meaning that it exclusively relies on data from the weather station and does not utilise data from third-party sources). Originally, ISD is designed to identify, and eventually characterise, weather stations that are deployed indoors (i.e., inside houses, boxes, closets, etc.), which is reflected in its name. While being designed, ISD has evolved to also detect stations located in enclosed areas (e.g., balconies), places with significant obstacles, and on tilted poles.
The ISD primarily relies on the parameter of solar irradiance. Therefore, without sufficient data of this parameter, ISD cannot make a decision about a station's deployment. Although the main comparison is between observed and theoretical solar irradiance, the analysis of wind, temperature, and relative humidity (RH) variances contribute significantly to the final decision. The final outcome of the ISD component is a characterisation of the weather station's deployment, which is provided daily and reflects the variations in the collected weather measurements. This characterisation can be used to determine whether specific parameters can be trusted. It’s important to note that atmospheric pressure measurements are valid, even when a weather station is located indoors.
2. ISD Categories
While the ISD was initially designed to identify only indoor stations, the experimentation with solar irradiance measurements has enhanced its capabilities, enabling it to detect a wider range of problematic cases and categories. These include:
- Outdoors
- Indoors
- Indoors Almost
- Bad Deployment
- Probably Bad Deployment
- Inclined Pole North
- Inclined Pole East
- Inclined Pole South
- Inclined Pole West
- Problematic light sensor
- Replace Illuminance
- Almost Night
- Indoors Frozen
- Indoors Almost Frozen
- Bad Deployment Frozen
- Probably Bad Deployment Frozen
- Unknown
- No firmware version
In the next paragraphs there is a comprehensive explanation of the 17 different ISD categories.
a. OUTDOORS. A station of the “OUTDOORS” category should observe a significant amount of solar irradiance through the day, and reasonable variations in temperature, RH, wind speed and wind direction (Figure 1).
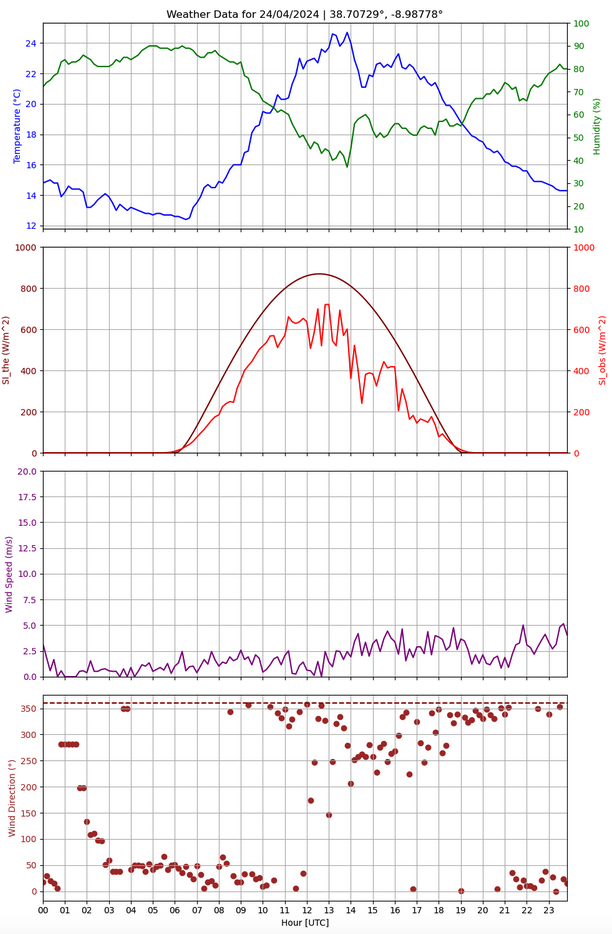
Figure 1. Temperature (blue) and Relative Humidity (green), Observed (light red) and Theoretical (dark red) Solar Irradiance, wind speed and wind direction of a station fell into the “OUTDOORS” category on 24/4/2024.
b. INDOORS. These stations are identified as being placed indoors (within a house, etc.) or in highly enclosed areas with significant obstacles that strongly affect the weather observations. This determination is based on the observation of low solar irradiance, as well as unreasonably low variations in wind speed/direction, temperature, and relative humidity, which are not expected in an open area environment (Figure 2). Consequently, the reliability of all observed variables from these stations is highly questionable.
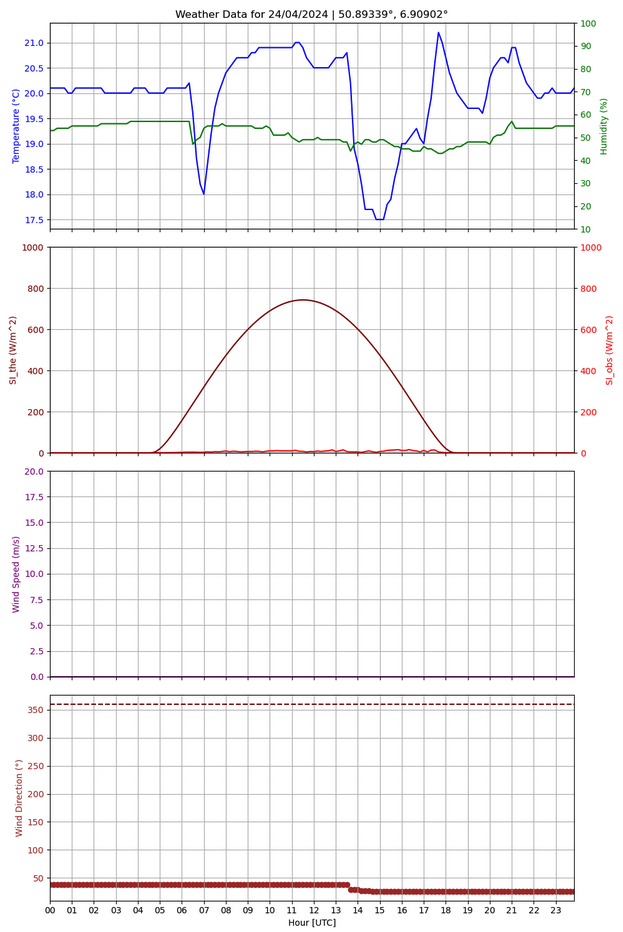
Figure 2. Same as Figure 1, but for a weather station that fell into the “INDOORS” category.
c. INDOORS_ALMOST. This category includes stations that seem to have reasonable variations in temperature and relative humidity through the day. However, even these two parameters may have a significant offset from the ground truth. Even if temperature and humidity looks reasonable, the reliability of the remaining observed variables from these stations is highly questionable (Figure 3). Such stations are considered to be in very closed areas (such as balconies or indoors next to an open window etc). Although this category is similar to the ‘INDOORS’, it actually indicates the probability that a station is surrounded by ‘fresh air’.
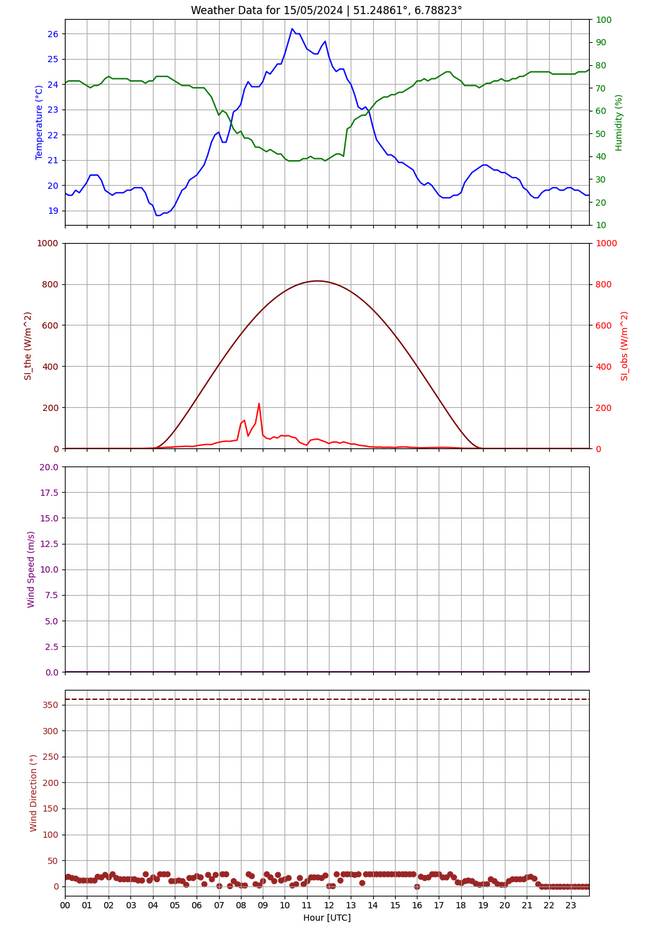
Figure 3. Same as Figure 1, but for a weather station that fell into the “INDOORS ALMOST” category.
d. BAD_DEPLOYMENT. In this category, stations appear to be poorly deployed. As an illustration, a station can typically be surrounded by significant obstacles that may affect not only the sensitive-to-obstacles parameters like wind and precipitation, but also temperature and humidity. It is highly likely that solar irradiance remains at unreasonably low levels throughout the day, with wind speed and direction exhibiting low variations, and even prolonged periods of calm conditions (Figure 4). If any data from these stations were to be utilised, it would only be for the parameters of temperature and relative humidity. However, even the reliability of these parameters remains uncertain.
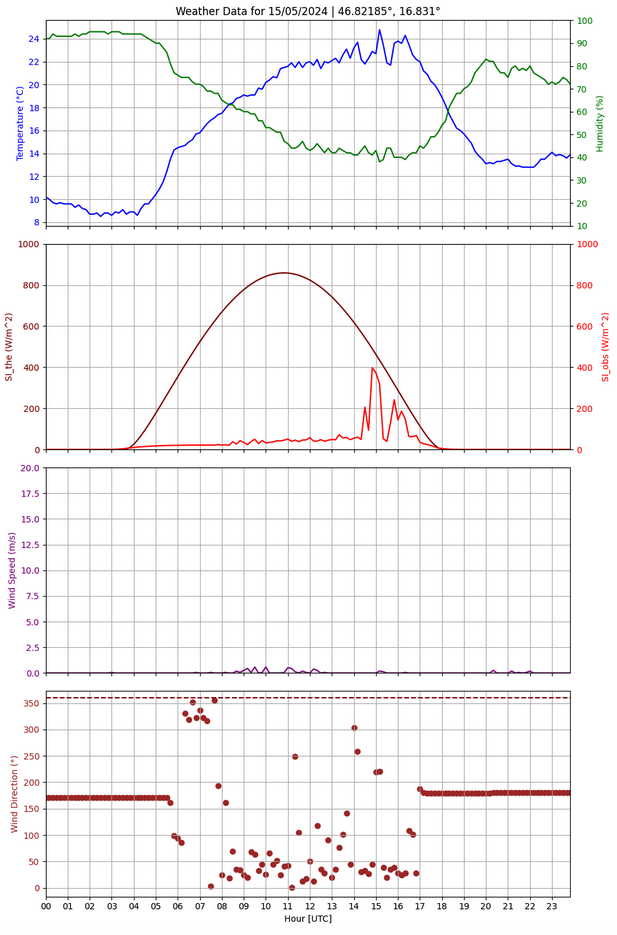
Figure 4. Same as Figure 1, but for a weather station that fell into the “BAD DEPLOYMENT” category.
e. PROBABLY_BAD_DEPLOYMENT. In this category, the weather stations do not always measure the expected variations in their measurements indicating that the deployment may be poor and some significant obstacles around may prevent from recording reliable measurements. Temperature and relative humidity readings should be used cautiously. Precipitation and wind speed/direction data may be unreliable, particularly when air flows from certain but (at the moment) unspecified directions. Solar irradiance readings are also not reliable. In general, any issues with the station would be mostly evident in the parameters related to solar irradiance and wind (Figure 5). The distinction from the "BAD_DEPLOYMENT" category lies in the deployment’s capacity to record higher solar irradiance throughout the day.
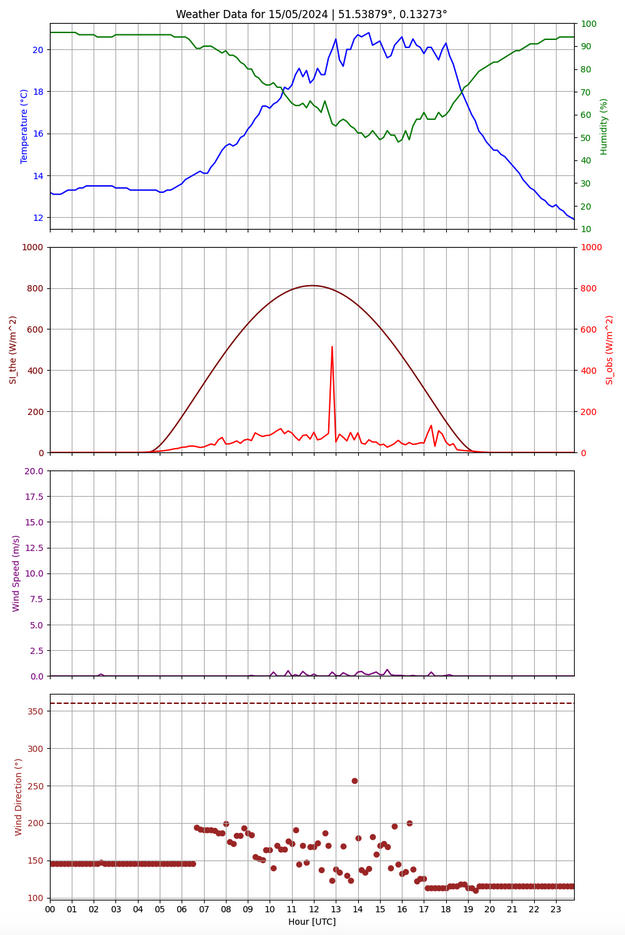
Figure 5. Same as Figure 1, but for a weather station that fell into the “PROBABLY BAD DEPLOYMENT” category.
f. INCLINED_POLE_*. Stations in this category are positioned on tilted poles. To account for the various tilt directions, there are four distinct categories, each identified by a letter at the end (N, E, S, W) that indicates the direction in which the pole is tilted relative to the horizon. In the specific case where a station falls into the ‘INCLINED_N’ category, this could be attributed to either a tilted pole or a dusty light sensor. A weather station can be classified into one of these categories only on cloudless days, when we can obtain a well-defined bell-shaped solar irradiance curve time series for comparison with the theoretical curve. Classification is not feasible on overcast or partly cloudy days (Appendix A1 - Figure 11).
g. PROBLEMATIC_LIGHT_SENSOR. Within this classification, the recorded solar irradiance consistently registers at 0W/m2. This may occur due to a faulty sensor, the presence of snow or other thick materials covering the sensor, or prolonged night in high latitudes during the winter. Although a constancy check is implemented in QoD v1 components, instances where solar irradiance remained consistently at 0 W m−2 were excluded. This exclusion arose from the uncertainty regarding whether the stations are located in areas that experience near-continuous nighttime for 24 hours each day. This ambiguity can now be addressed in ISD by comparing the data with theoretical solar irradiance. Since such faulty solar irradiance measurements cannot assist in taking any decisions under these circumstances, these stations are excluded from the ISD process. In this category, stations constantly report a solar irradiance of 0W/m2, a behaviour that cannot be explained by the theoretical solar irradiance (Figure 6). Although our analysis did not reveal any stations with unusual variations in temperature, relative humidity, or wind speed/direction, as the time series data from these stations cannot undergo the ISD process, there remains the possibility that these stations may be unreliable.

Figure 6. Same as Figure 1, but for a weather station that fell into the “PROBLEMATIC ILLUMINANCE” category.
h. REPLACE_ILLUMINANCE. In this category, observed solar illuminance exhibits irrational spikes, usually out-of-bounds. Such solar irradiance measurements are not valid and these stations are excluded from the ISD process. Such issues may also be detected by QoD v1.0, allowing for the results from the different QoD components (Out-Of-Bounds -OBC-, Self Quality Check -SQC- and ISD) to be cross-verified.
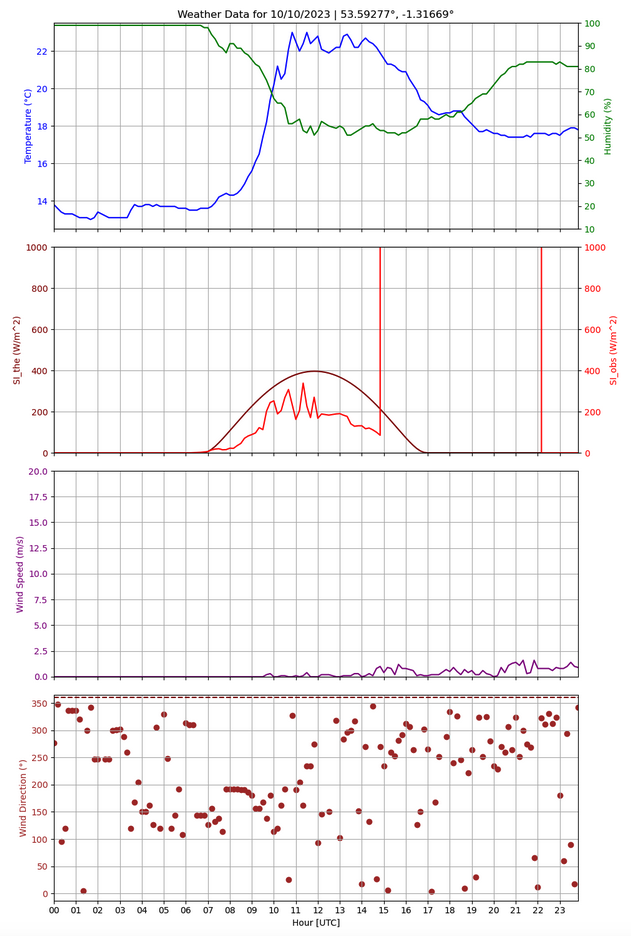
Figure 7. Same as Figure 1, but for a weather station on 10/10/2023 that fell into the “REPLACE ILLUMINANCE” category.
i. ALMOST_NIGHT. There is no way to determine the condition of a deployment through the ISD when the daily mean solar irradiance is <5 W m−2 (Figure 8), as the solar irradiance signatures we seek cannot be detected under these conditions. Stations located in high latitudes are typically expected to measure very low temperatures or may even be completely frozen. This category is used to distinguish between stations that are located in artificially dark conditions and those that are affected by physically prolonged dark conditions.
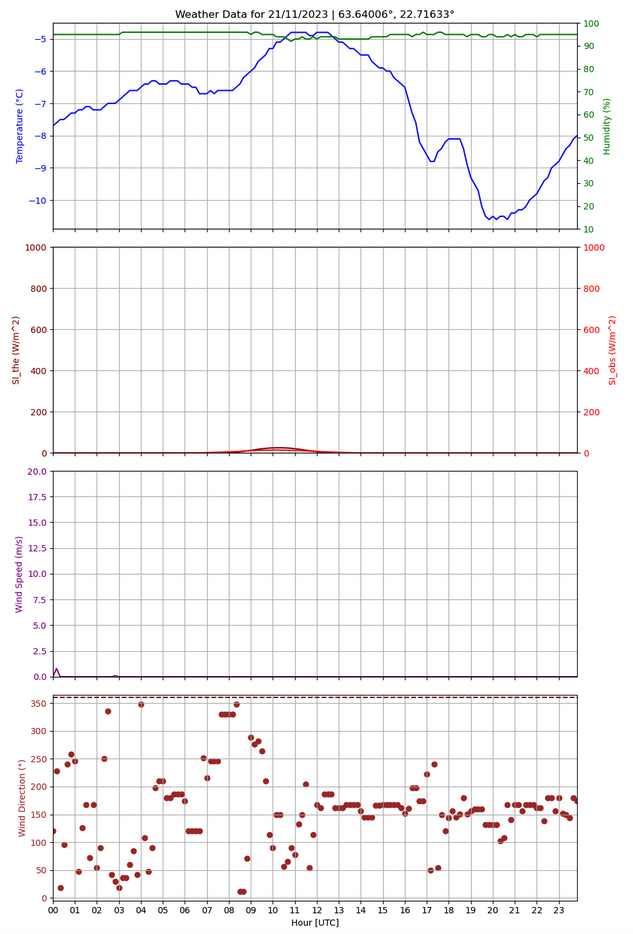
Figure 8. Same as Figure 1, but for a weather station on 21/11/2024 that fell into the “ALMOST NIGHT” category.
j. *_FROZEN. If a station falls into one of the categories ‘INDOORS’, ‘INDOORS_ALMOST’, ‘BAD_DEPLOYMENT’, or ‘PROBABLY_BAD_DEPLOYMENT’, and the (TMD) is <0.5°C, then this station is reclassified into the same category but with the suffix ‘_FROZEN’. This method aims to exclude potential false positives caused by frozen sensors, such as low solar irradiance readings from a light sensor covered by snow.
k. UNKNOWN. Stations that provide less than 40% of the expected data packets, during the period that solar altitude is greater than 7°, fall into this category. This occurs because the solar curve cannot be adequately represented, making it difficult to determine whether any significant obstacles are present near the station (Figure 9).
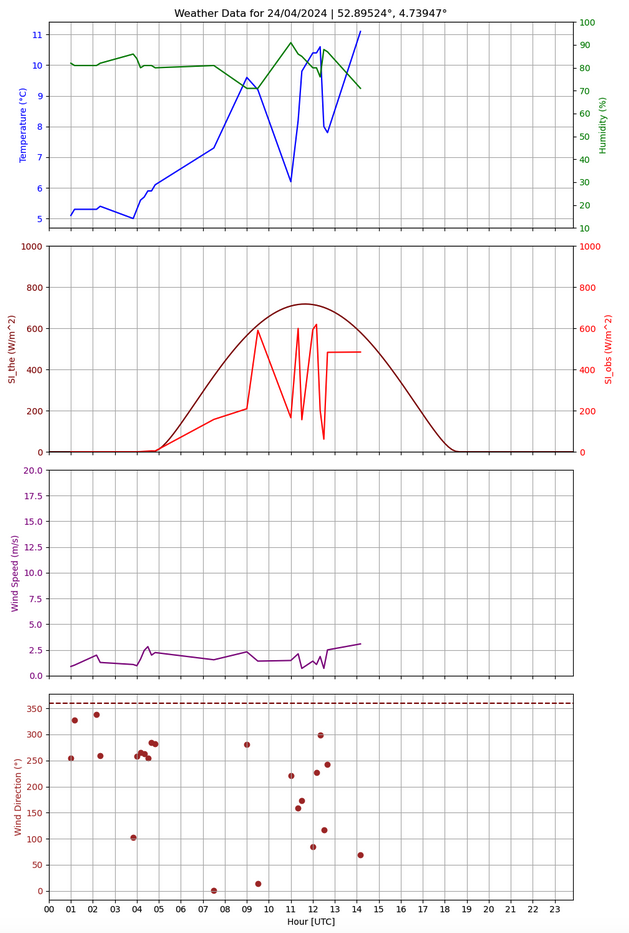
Figure 9. Same as Figure 1, but for a weather station that fell into the “UNKNOWN” category.
l. NO FIRMWARE VERSION. If the firmware version is missing, it becomes unclear whether the solar irradiance value has been corrected. An uncorrected solar irradiance value is multiplied by 10, which could cause the ISD to mistakenly classify the deployment as faulty. However, this is an annotation for internal use only and it does not affect user's rewards.
3. The Method
3.1 Parameters
The method is primarily based on solar irradiance measurements in order to compare them with the theoretical solar irradiance for a given location and day (Nijegorodov, 1996; Ahmad and Tiwari, 2011). The theoretical solar irradiance algorithm returns the following parameters:
a. (SIthe): the diurnal theoretical solar irradiance under clear sky conditions (W/m2) SIthe is one of the most important parameters for ISD and it is produced for every single location, day of the year and hour of a day. It is the reference parameter for evaluating how reasonable the levels and the variations of the observed solar irradiance are throughout the day. Typically the observed solar irradiance (SIobs) is lower than the theoretical. Nevertheless, during a partly cloudy day, solar irradiance spikes may significantly exceed the theoretical curve due to the “Cloud Enhancement” phenomenon caused by the Mie Scattering effect (Jarvela et al., 2020).
b. SA (Solar Altitude): the angular elevation of the center of the solar disk above the horizontal plane (degrees) SA is useful for filtering the observations of a station, when solar measurements are too low to be usable.
After: a. cleaning (SIthe) and (SIobs) from NaNs, b keeping only the solar data corresponding to SA >7° in order to exclude the near-zero/zero values and c. keeping only the solar data for which (SIthe) >0.1(W/m2) and (SIobs) is not NaN, we derive the following solar irradiance dependent parameters:
- Daily average ratio between (SIthe) and (SIthe) ((RatioSIOT_daily)) (which ranges between 0 and >1). In properly deployed weather stations, the expected value is typically &ht;1. However, very low values, such as <0.05, raise concerns and suggest that the weather station may not be properly deployed. Very high values (e.g., >1.5) suggest a probably faulty light sensor.
- Daily average of SI_the (SIthe_daily_avg) (W/m2). Days with average SI_the <5W/m2 are considered as days that ISD cannot effectively detect problematic deployments.
- Daily maximum of SI_the (SIthe_daily_max) (W/m2) It is used indirectly to calculate thresholds of statistical metrics (like residual standard error and correlation coefficient of solar irradiance measurements - see parameters i and j) to determine some of the criteria that a station falls into a problematic class.
- Count ratio between observed and theoretical solar irradiance (CRSI_OT), which is the ratio between the number of the non-nan SIobs and the number of the SIthe when SIthe > 0 W/m2 This is one of the most important parameters that makes the first filtering. Weather stations that observe 0 W/m2 for long periods through a day, while the theoretical solar irradiance suggests values > 0W/m2 are considered as suspicious.
- Standard Deviation of of observed SI_obs (SIobs_sd) (W/m2) It is a good indicator for distinguishing between problematic deployments with low solar irradiance (low variance of solar irradiance due to significant obstacles or indoors placement) and non-problematic ones during overcast (larger variance of solar irradiance as the thickness of clouds varies through a day allowing less or more light to reach the light sensor)
- Percentage of NaN SI_obs elements (PSI_ON_AN) (%) versus the total number of the SI_obs elements This is a simple ratio that indicates the availability of observations. To make decisions based on solar irradiance data, we need to have a sufficient amount of data. Therefore, we set the availability threshold at 40%.
- Correlation coefficient between observed and theoretical solar irradiance (ccOT) This metric is utilised in the calculations for the inclination criterion. High values of this metric indicate a strong similarity between theoretical and observed solar irradiance, which typically occurs in a well-deployed station on a cloudless day.
- Residual Standard Error (RSE) between the observed solar irradiance measurements and the polynomial fit of 5th order on them (W/m2) RSE is valuable for identifying completely cloudless days, which can help in detecting tilted masts. Low RSE indicates small deviations of the SIobs from the polynomial fit, which is characteristic of cloudless days.
- Correlation coefficient threshold (ccOT_thres) It is empirically calculated and ranges between 0.990 and 0.995 for a corresponding SIthe_daily_max range of 400 to 700 W/m2. The relationship between the two is cubic.
- RSE threshold (RSEthres) (W/m2) It is empirically calculated and ranges between 5 and 50 for a corresponding SIthe_daily_max range of 5 to 1000 W/m2. The relationship between the two is quartic.
- Inclination criterion, which consists of two sub-parameters, the inclination (Inclined/Normal) and the inclination orientation (N/E/S/W) This parameter indicates whether the pole is tilted (inclination) and the direction of the tilt (inclination orientation).
We also clean from NaNs and use the parameters of temperature, RH, wind speed and wind direction to support the ISD analysis. We then calculate the following metrics based on the non-solar parameters mentioned above:
- Temperature standard deviation (TSD) (°C) It has been observed that low temperature variations, in the absence of increased humidity throughout the day, indicate that a weather station is situated in a confined area where airflow is minimal or non-existent.
- Temperature daily median (TMD) (%) (considering all 24-hour temperature observations) It is used to determine if a day was too cold for the sensors to freeze. The threshold below which there is a likelihood of the sensors freezing is set at 0.5°C.
- RH standard deviation (RHSD) (%) It has been observed that low RH variations, in the absence of increased humidity throughout the day, indicate that a weather station is situated in a confined area where airflow is minimal or non-existent.
- RH daily median (RHMD) (%) (considering only RH observations when solar altitude >7°) It is used to define a day as wet to assist in the investigation of parameter variance. Under wet conditions (e.g., relative humidity > 85%), temperature, relative humidity, wind, and solar irradiance may show minimal variations over time.
- Variance of the differences of the consecutive RH observations (RHvar_diff) (%) (considering only RH observations when solar altitude >7°) It is the variance of the differences between consecutive RH measurements. This metric is used to differentiate between ‘INDOORS’ and ‘INDOORS_ALMOST’. Weather stations that may have some potential for outdoor deployment, while most parameters suggest that they are positioned indoors, often exhibit greater fluctuations in relative humidity (RH).
- Wind speed standard deviation (WSPDSD) (m/s) It is a reasonable assumption that small variances in wind speed throughout the day, combined with low variances in other parameters under relatively dry conditions, may indicate a problematic deployment (dry conditions are associated with sunny days, which result in differential evaporation and heating over surfaces, eventually leading to the formation of air flows). While a weather station placed indoors should ideally show zero variations in wind speed, there may be sources of airflow (e.g., windows, cooling or heating systems) that can introduce some variation. Therefore, we establish low but not zero thresholds to filter out poorly deployed stations.
- Wind speed constancy index (True/False) This index is considered true when the most frequently observed wind speed occurs for more than 50% of the day. It is highly unlikely for a constant wind speed (usually at 0 m/s) to persist for half of the day. Additionally, when paired with low solar irradiance or a low RHMD (thus in relatively dry conditions), this situation suggests a criterion for poorly deployed stations.
- Wind direction circular variance (°) (after converting degrees into radians) We use circular variance for wind direction since it is a circular parameter. A significant lack of variance in wind direction can support the assumption that a weather station is poorly deployed.
- Wind direction constancy index (True/False) This index is True when the most common wind direction observation appears in more than 50% of the day. It is used similarly to Wind speed constancy index.
3.2 Algorithm
The mechanism consists of a complex if-then-else structure that was developed based on exploratory data analysis (EDA), utilizing a set of reasonable assumptions and criteria that were gradually confirmed through the EDA process. Although the algorithm is publicly available, we will present the main groups of criteria used to characterise the deployment condition of a weather station.
The first filtering drops the stations into 3 main ‘buckets’ which are:
a. Stations with valid data for decision-making (PSI_ON_AN > 40% and SIthe_daily_avg > 5W/m2) b. Stations located in geographical areas (high latitudes during winter) where sunlight is insufficient throughout the day to detect any patterns and, eventually, make decisions (PSI_ON_AN > 40% and SIthe_daily_avg ≤ 5W/m2). These stations fall into the ‘ALMOST_NIGHT’ category. c. Stations with inadequate data due to significant data loss during the day (PSI_ON_AN ≤ 40%). These stations fall into the ‘UNKNOWN’ category.
Therefore, the first of the three aforementioned categories includes all the stations that have sufficient data and sunlight, allowing us to identify any deployment issues. Following the initial filtering, the stations that provide enough data fall into the next three categories:
a. CRSI_OT = 0 These stations are unable to observe any sunlight during the day, indicating that they are likely placed indoors. However, if some variation in wind speed is observed, it may suggest that the stations are located in an area with numerous significant obstacles nearby (e.g., deployed on a balcony or under a roof etc.). However, if all the other parameters variate as expected, then the light sensor may be problematic.
b. 0% < CRSI_OT <40% Such stations still register unexpectedly low sunlight during the day, suggesting that the station may be positioned indoors (where some sunlight might pass through windows) or could be poorly deployed (with sunlight significantly blocked by obstacles). To differentiate between an indoor station and a poorly deployed station, we utilize a series of criteria that evaluate the variability of temperature, RH, and wind. For example, a station that experiences low sunlight along with low variations in temperature, RH, and wind speed/direction, under a regime of RHMD <85%, is considered to be indoors.
c. CRSI_OT < 40% This category can lead to almost any of the ISD classifications through a complex set of empirical criteria. To ensure that we focus only on the problematic cases, we utilise RatioSIOT_daily, specifically investigating cases with a ratio of <0.2. Additionally, we examine the variations in temperature, RH and wind to determine if a station is surrounded by significant obstacles. The variability of solar irradiance further assists in understanding whether physical variations occur throughout the day. In addition, we apply the inclination criterion (Appendix A1) using a threshold of <1.5 for the RatioSIOT_daily.
As expected, stations with low CRSI_OT and/or low RatioSIOT_daily are classified into one of the problematic categories rather than the OUTDOORS category (Figure 10).
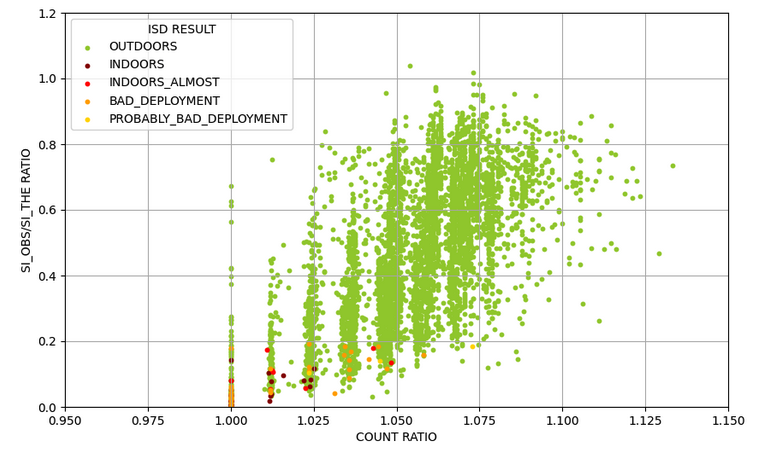
Figure 10. Observed-to-theoretical solar irradiance ratio versus the count ratio, categorised by the five basic ISD categories. To enhance the readability of the graph, very few stations with extremely high or low count ratios and/or observed-to-theoretical solar irradiance ratios have been excluded from the presentation..
3.3 Final Aggregator
The ISD mechanism evaluates the previous day’s data on a daily basis and produces one result per station, per day. There are various reasons why a station’s ISD result may vary from day to day (e.g., the statistical nature of the algorithm, environmental conditions to which the station is exposed, etc.). For this reason, the ISD Aggregator takes into account the results from the last seven days to assign the final classification of each station’s deployment.
To decide on a unique ISD annotation that determines the final Quality of Deployment (QoD) score, the ISD Aggregator considers the results of the last 7 days for each station. To determine this unique annotation, the algorithm considers the following criteria:
a. Dominant ISD Annotation: The annotation that characterises the deployment of a meteorological station is the one that appears most frequently within the 7-day period.
b. Tie-Breaker Criteria: If two or more annotations are equally frequent within the 7-day period, the dominant annotation is determined by its assigned weight (see Table 1). The weight reflects both the significance of an annotation and the algorithm’s strategy to assign greater importance to more problematic annotations (e.g., Indoors) over less problematic ones (e.g., Probably Bad Deployment).
c. Insufficient Data: If 50.1% of the days (in this case, 4 out of 7 days) lack sufficient data, a decision cannot be made for the station. In this scenario, the dominant annotation is marked as UNKNOWN. This implies that for newly claimed stations, users must wait at least 4 days to receive an ISD annotation from the aggregator.
Table 1. ISD Annotations, their weight of significance and their ISD score.
| ISD Annotation | Weight | Score |
|---|---|---|
| OUTDOORS | 6 | 1 |
| INDOORS | 10 | 0 |
| ALMOST INDOORS | 9 | 0 |
| BAD DEPLOYMENT | 8 | 0.29 |
| PROBABLY BAD DEPLOYMENT | 7 | 0.43 |
| INCLINED POLE NORTH | 5 | 0.86 |
| INCLINED POLE EAST | 5 | 0.86 |
| INCLINED POLE SOUTH | 5 | 0.86 |
| INCLINED POLE WEST | 5 | 0.86 |
| PROBLEMATIC LIGHT SENSOR | 4 | 0.86 |
| REPLACE ILLUMINANCE | 3 | 0.86 |
| ALMOST NIGHT | 1 | 1 |
| INDOORS FROZEN | 2 | 1 |
| INDOORS ALMOST FROZEN | 2 | 1 |
| BAD DEPLOYMENT FROZEN | 2 | 1 |
| PROBABLY DEPLOYMENT FROZEN | 2 | 1 |
| UNKNOWN | 1 | 1 |
3.4 Final ISD Score
The final score assigned to a station is directly related to its deployment classification from the ISD and is shown in Table 1. It should be noted, however, that this score is used by another algorithm (called the Unifier), which combines the scores from the individual quality mechanisms to produce the station’s final daily quality score.
4. Limitations
It's important to note that the ISD is a blind method, meaning it was developed without having many stations with known deployment status to initially validate the technique. Instead, it relied on a series of logical assumptions and criteria based on exploratory data analysis. Practical validation of ISD results is not always feasible, as deployment status can ultimately only be confirmed through photographs. However, the final version of the algorithm was evaluated on a small sample of test weather stations. Generally, there is a high degree of confidence that only problematic deployments are classified into the ISD’s problematic categories. The ISD criteria were intentionally designed to be as stringent as possible to detect exclusively problematic cases in order to avoid false positives. This strictness implies that some problematic deployments may go undetected by this mechanism. Additionally, a station can shift between categories from day to day based on weather conditions (e.g., strong winds, sunny days in winter or summer, etc.).
Below, we outline some limitations encountered during our data analysis:
- ISD mainly aims to detect “INDOORS” stations. Some poorly deployed weather stations may also be detected. However, future QoD components will be able to detect more efficiently poorly deployed stations.
- Numerous poorly deployed weather stations might be classified as "OUTDOORS." This situation can result from significant fluctuations in solar irradiance due to a temporary unobstructed line of sight between the station and the sun. As a result, the light sensor may record the anticipated levels of solar irradiance and its variations for a few hours during the day. For example, this can occur even in the case of a weather station located next to an open window.
- Weather stations located indoors, where the user has ensured adequate sunlight and occasional airflow toward the station (such as through an open window, a fan, or an air conditioner), may be misclassified. Although it is very likely that such a station will fall into one of the problematic categories, the classification may not be accurate.
- Distinguishing between “PROBABLY_BAD_DEPLOYMENT” and “BAD_DEPLOYMENT” is not always an easy task. Depending on the dominant weather conditions (e.g. cloudless or dark foggy weather) a “BAD_DEPLOYMENT” weather station may fall into the “PROBABLY_BAD_DEPLOYMENT” or vice versa.
- Stations that fall into the categories “REPLACE_ILLUMINANCE”, “PROBLEMATIC_ILLUMINANCE”, “ALMOST_NIGHT” and “UNKNOWN” may be poorly deployed, but it is impossible to categorise them through this process.
Appendix
A1. Inclination Criterion
This set of criteria assists in detecting tilted masts on which stations are deployed. Note that tilted masts can only be detected on completely cloudless days. To achieve this, we check the ccOT and RSE to understand the degree of similarity between observed and theoretical solar irradiance curves. In general, we search for high ccOT (>0.8), low RSE (< RSEthres) and RHMD <85% for the period of the day that solar altitude is >7° (to ensure that at least the lower troposphere is fairly clear). This cloudless condition is essential for detecting any inclinations of the pole.
The process of detecting north-south tilted poles is different from this for detecting east-west tilted poles.
To identify a north-tilted pole, we apply a straightforward criterion. The criterion is that the RatioSIOT_daily should be between 0.3 - 0.67 when the cloudless condition is met. This indicates that a station measures significantly lower solar irradiance than expected during a cloudless day. In contrast, a station on a south-tilted pole is characterised by RatioSIOT_daily between 1.05 and 1.4. This indicates that a station measures significantly higher solar irradiance than expected during a cloudless day. Ratios <0.3 are typically observed at poorly deployed stations that do not have direct exposure to sunlight, while ratios <1.4 are indicative of problems with the light sensor.
On the other hand, to identify east/west-tilted poles, we use a more complex approach, summarised in the following steps:
- Firstly, the RatioSIOT_daily should be <0.9, as SIobs can be significantly lower for extended periods during the day when the pole is tilted to the east or west. It is important to note that SIobs should naturally be consistently slightly lower than the SIthe curve on a cloudless day.
- Next, the daily time series of the solar irradiance ratio between observed and theoretical values should be divided into four segments of equal time length.
- If the RatioSIOT_daily of the fourth segment is >0.9 and the difference between the fourth and the first segment is >0.4, then the pole is tilted to the west.
- If the RatioSIOT_daily of the first segment is >0.9 and the difference between the fourth and the first segment is <0.4, then the pole is tilted to the east.
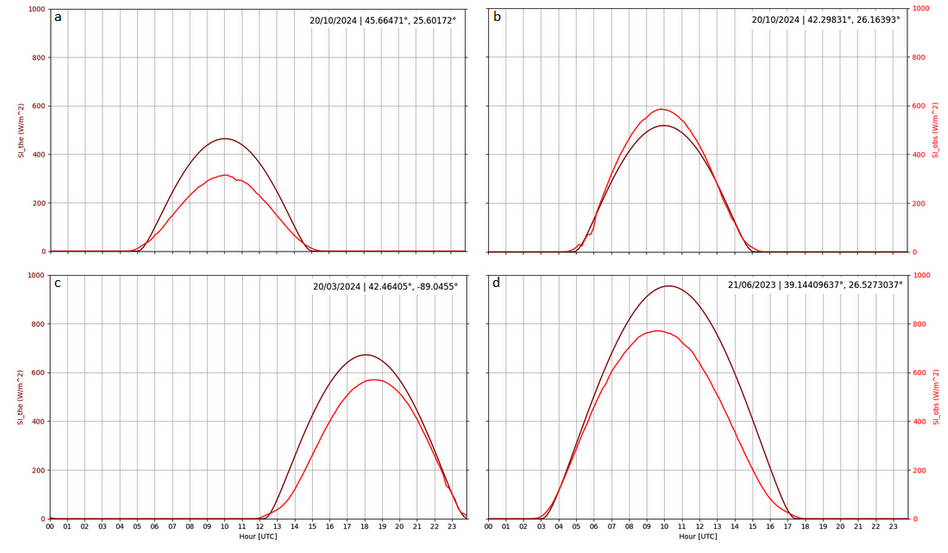
Figure 11. Theoretical (dark red) and observed (light red) solar irradiance of cloudless days as estimated/measured by a station on a. south tilted, b. north tilted, c. west tilted and d. East tilted pole.
References
Ahmad, M. J., & Tiwari, G. N. (2011). Solar radiation models—A review. International Journal of Energy Research, 35(4), 271-290.
Järvelä, M., Lappalainen, K., & Valkealahti, S. (2020). Characteristics of the cloud enhancement phenomenon and PV power plants. Solar Energy, 196, 137-145.
Nijegorodov, N. (1996). Improved ASHRAE model to predict hourly and daily solar radiation components in Botswana, Namibia, and Zimbabwe. Renewable energy, 9(1-4), 1270-1273.